Quick Links
Contact Us
Send a Message
Newsletter
We will get back to you as soon as possible.
Please try again later.
Bond Market Update
Interest rates continued to march higher in the third quarter. In July the Federal Reserve raised the Fed Funds rate for the tenth time to a range of 5.25%-5.5%. The labor market remains firm with the unemployment rate to 3.8%. Although inflation has declined, it is still not near the Fed’s target of 2%. The battle to bring inflation down is being complicated by higher energy prices due to OPEC+ withholding production, a still firm economy, strong labor markets, and high interest rates which trickles into inflation of goods and services.
Fed officials are concerned about the risk of raising rates too little and allowing high inflation to grow entrenched and raising rates too much and causing a severe downturn. A recession in the next six to nine months is still a strong possibility. The full impact of the ten interest rate increases has yet to be felt. The yield curve remains inverted, although less so, an event which typically is a precursor to recessions. If an economic slowdown were to occur, then we can expect a pivot to rate cuts. However, absent a recession, which should be preceded by a climb in the unemployment rate, short term interest rates may remain at current levels for an extended period. The Fed did not raise rates at its September meeting but in his statement, Fed chairman Powell indicated rates will stay higher for longer. This has spooked both bond and equity markets. Bond yields rose significantly near quarter end as a result.
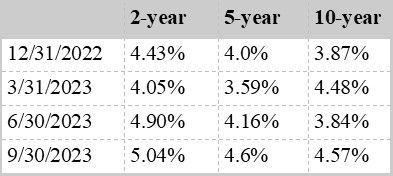
Here is a recap of yield levels this year for US treasury securities:

As this chart shows, the yield curve’s inversion is not as extreme. The 2– to 10-year spread is now -47 basis points versus -106 basis points at the end of June. With the Fed almost done with rate hikes there is less risk of much higher short-term rates. The more extreme move in the 10-year can only be explained by heightened fears of inflation and possibly a supply demand imbalance for US government securities; the Fed has been reducing its holdings of treasuries through both maturities and outright sales while at the same time the government’s growing deficit has increased the supply of treasuries.
Total returns on all types of bonds have been negative this year. We have emphasized shorter maturity bonds as interest rates moved higher. The worst returns have been on ultra long bonds. Take for example the US Treasury 1.25% due May 15, 2052, which today trades at a price less than $50 down from $100 less than 3 years ago. A return even worse than you would experience in the stock market. A sharp reversal in interest rates would of course see these bonds increase significantly in price.
While the current level of yields exceeded our expectations, we feel current interest rate levels are at or near the peak for this cycle. Short term rates at a 22 year will eventually work their way into slowing the economy. The sharp increase in longer term rates will act as a mechanism to slow growth and is in effect acting as another rate increase. Therefore, while it may be an extended period before rate cuts, absent a further spike in inflation, it does not mean interest rates have to rise much further.
Going forward we see four factors which can negatively impact the economy and contribute to causing a recession:
- Costly labor agreements as highlighted by the auto workers and Hollywood workers’ strikes, among others.
- A potential government shutdown once the current budget agreement expires in mid-November.
- Recent resumption of student loan payments impacting consumer spending.
- Oil shocks from recent world events, a negative for a variety of reasons.
While not all of these may occur; even one or two, combined with historically high interest rates, could slow growth enough in the next six to nine months for the Fed to begin to reduce interest rates. A pivot to rate cuts if a recession were to occur would lead to at least a modest decline in interest rates.
A look at Bond Yields
With rising interest rates, bonds are now back in the spotlight. When yields were low, investors looked at bonds more for protection as opposed to high income. Now with higher yields, people are looking at bonds for both return of principal and high earnings. When buying bonds or bond funds it is important to know that there are many kinds of yield, and they are all calculated differently. These include current yield, yield to maturity, yield to call, yield to worst, and SEC yield.
Let’s look at each of these and highlight any shortcomings:
Current yield – this is calculated by taking a bond’s coupon divided by its price. This yield accounts only for the coupon income with no consideration given for a discount or premium bond which would result in capital gain or loss if held to maturity. It also ignores the time value of money where a dollar today is worth more than a dollar in the future.
Yield to maturity – this is the most common measure used to bond yields. It does consider the time value of money and is an accurate measure of a bond’s yield.
Yield to call – for bonds that can be redeemed prior to maturity, this is the yield on a bond to its first call or redemption date. For bonds purchased at a premium you will most likely earn the yield to call (which would be lower) not the yield to maturity since these bonds have a good chance of being redeemed prior to maturity.
Yield to worst – For individual bonds it is helpful to compare the yield to maturity to the yield to call to see which will result in the lowest yield. This is known as the yield to worst. In the above case, the yield to call would be the lower expected yield.
Note: The above measures of yield are less relevant for bond funds since bond managers rarely hold bonds to maturity.
SEC yield – this metric was introduced by the Securities and Exchange commission and is designed to give investors a meaningful way to compare yields on bond funds. It is a measure of a fund’s income over the past 30 days.
Just as there is no single way to value equities, the same is true of yield calculations for bonds. Using only one measure of yield could mean a bond investor misses out on important signals particularly when yields are changing rapidly. For example, with the recent rapid rise in yields the focus for individual bonds should be on yield to maturity as yield to call will not be a factor in most cases.
As always, if you have questions about the bond market or other topics, reach us at (833) 888-0534 x 2 or by email.
The views and information contained in this article and on this website are those of West Branch Capital LLC and are provided for general information. The information herein should not serve as the sole determining factor for making legal, tax, or investment decisions. All information is obtained from sources believed to be reliable, but West Branch Capital LLC does not guarantee its reliability. West Branch Capital LLC is not an attorney, accountant or actuary and does not provide legal, tax, accounting or actuarial advice.
About The Author
James K. Ho
Jim has over thirty years of investment management experience. He is a Managing Director and Principal of the firm. Prior to West Branch Capital, Jim was a fixed income Portfolio Manager at John Hancock Advisors. Previously, he managed the John Hancock Tax Exempt Income Trust. Prior to joining John Hancock Advisors, Jim was a Senior Investment Officer at The New England (MetLife), where he managed multiple bond portfolios, including taxable and tax exempt mutual funds and separate accounts. Jim holds an M.B.A. from Columbia University, New York, as well as an M.S. in Applied Math and B.S. in Applied Math and Economics from the State University of New York at Stony Brook. He is a Chartered Financial Analyst and a member of the Boston Society of Security Analysts.
Important Links
Subscribe to our newsletter
Newsletter
Thanks for subscribing to our newsletter.
Please try again later.
Our Locations
Contact Us
Send A Message
Footer Form
We will get back to you as soon as possible.
Please try again later.
West Branch Capital was recognized by investor.com as a 2019 Trusted Firm. View our profile. To learn more about the trust algorithm, visit investor.com/trust-algorithm.
The Financial Times 300 Top Registered Investment Advisers is an independent listing produced annually by the Financial Times (June, 2017). The FT 300 is based on data gathered from RIA firms, regulatory disclosures, and the FT’s research. The listing reflected each practice’s performance in six primary areas: assets under management, asset growth, compliance record, years in existence, credentials and online accessibility. This award does not evaluate the quality of services provided to clients and is not indicative of the practice’s future performance. Neither the RIA firms nor their employees pay a fee to The Financial Times in exchange for inclusion in the FT 300.
All Rights Reserved | West Branch Capital


