Contact Us


Send a Message

Get the latest news delivered to your inbox.

Newsletter

West Branch Capital Logo

Independent fee-only, minority owned SEC Registered Investment Adviser

Midyear Bond Update

August 28, 2024
Midyear Bond Update

As the second quarter began, interest rates resumed their uptrend after having declined earlier this year. Several inflation readings indicated inflation had stopped falling, with some measures showing upticks in price pressures. The Federal Reserve has a dual mandate of maximum employment and price stability. While prices have come down, inflation remains above the Fed’s target of 2%. After ten interest rate increases the economy remains firm with only employment showing some signs of softening. The Federal Funds rate at 5-5.25% is the highest in over 22 years.


However, by mid-May signs of cooling inflation ignited a bond rally. Bond prices rose sharply and pushed down the yield on the 10-year US treasury note. The yield on the 10-year ended the quarter at 4.35%. This is down from close to 5% in the first quarter and as high as 4.7% early in the second quarter. At the Fed’s meeting in June officials indicated they expect only one rate cut this year; down from as many as six cuts expected by investors in January. Despite the possibility of just one rate reduction, bond prices marched higher as investors believe that the recent streak of surprising price jumps, during the first few months of the year, was more of an aberration than a break in the trend of inflation moderating.


The rapid increase in interest rates has little historical precedent. The full impact of the Fed’s actions has not yet worked its way through the economy. When the Fed raised rates in the past, it often lifted them to the point that the job market weakened, causing the economy to slow which then led them to reverse course and cut rates. Despite high interest rates, this has not occurred. Reasons cited are strong income growth, record stock prices fueling portfolio gains and driving consumer optimism, and excess savings from pandemic relief funds. The yield curve remains inverted but less so with the two- to ten-year spread at -40 basis points compared to -106 basis points one year ago. When short term rates are higher than long term rates it implies investors’ preference to lock in long term rates with the expectation that the Fed will ultimately reduce rates. Typically rate reductions are in response to a weakening economy which is a precursor to a recession. The timing of a recession is uncertain, but we think it is likely to occur sometime later this year or early in 2025.


We expect interest rate reductions will come if either inflation retreats closer to the Fed’s target of 2% or the economy weakens, and a recession looms. If inflation declines closer to 2% and the economy avoids a recession, then a soft landing will have been achieved meaning low inflation without an economic slowdown. In this scenario the Fed will reduce rates but cautiously to avoid stoking inflation. Stocks should do well, and interest rates will decline slightly. A soft landing is not our expected outcome. If the rate reduction is due to an economic recession, then stocks may come under pressure while bond yields should decline as the Fed will reduce rates more aggressively. We believe this is the more likely outcome.


Why it may be an opportune time to extend out on the yield curve, and a review of Breakeven Yields


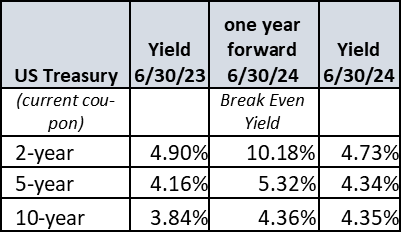
Interest rates have risen at an unprecedented pace. One year ago, we looked at breakeven yields on three maturities of US treasury securities; that is, how high do rates need to go up in one year to breakeven or not lose money on that maturity? Here is what we calculated:

bond market update


The above table shows a two-year bond purchased on 6/30/23 where the 4.9% yield to maturity would need to increase to a yield greater than 10.18% in one year for it to result in a negative return. The other maturities are shown above. These levels were not reached on 6/30/24 (last column) and only the 10-year came close. Essentially, at that time, the bulk of the losses in bond prices had already occurred.

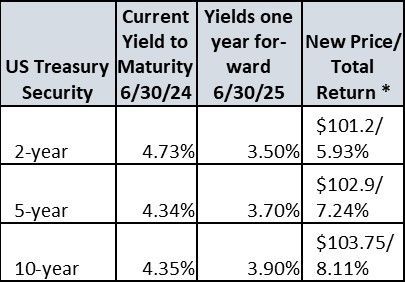
Now with the Fed about to lower rates we can look at returns that can be achieved one year forward by investing in each of these maturities. Since the yield curve should steepen as the Fed reduces short term rates, we will assume a normal upward sloping curve will develop in one years’ time.

bond market update


* Total return is price change plus coupon payment over one year.


This chart shows that when the Fed eases and yields decline, the yield curve will steepen (short rates declining faster than long term rates). The greatest potential return will come from the longer end of the curve. The more yields decline the greater the advantageous return from longer term securities. Therefore, it may appear risky to extend out on the yield curve, but when rate cuts do occur, longer maturities will perform best even as their yields decline less. While investors should remain cautious given current economic and inflation trends and Fed policy intentions, a modest pivot to maturity extension may be in order.


Since we are in a presidential election year it may be instructive to look at how the Fed might behave. In general, the Fed will be more cautious with major policy changes but will not sit on the sidelines during an election year. It wants to avoid the appearance of influencing the political process. It will continue to pursue its dual mandate of price stability and maximum employment. Any significant policy action would be the result of clear evidence of the need to raise or lower rates. In most election years, the Fed has either raised or cut rates. Since interest rates are already at recent high levels, we are not likely to see interest rate increases. Cuts are more likely given the Fed’s stated intentions. The Fed will be transparent to ensure communication of its intentions and that they are based on economic considerations, not political.


Who wins the election will also matter for Fed policy. A potential Trump victory may result in large tax cuts swelling the deficit and fueling inflation. Imposing sweeping tariffs could also add to inflation. Investors and the Fed will react accordingly.


If you have any questions on this topic, please reach us at (833) 888-0534 x2 or info@westbranchcapital.com


The views and information contained in this article and on this website are those of West Branch Capital LLC and are provided for general information. The information herein should not serve as the sole determining factor for making legal, tax, or investment decisions. All information is obtained from sources believed to be reliable, but West Branch Capital LLC does not guarantee its reliability. West Branch Capital LLC is not an attorney, accountant or actuary and does not provide legal, tax, accounting or actuarial advice.


About The Author

James K. Ho

Jim has over thirty years of investment management experience. He is a Managing Director and Principal of the firm. Prior to West Branch Capital, Jim was a fixed income Portfolio Manager at John Hancock Advisors. Previously, he managed the John Hancock Tax Exempt Income Trust. Prior to joining John Hancock Advisors, Jim was a Senior Investment Officer at The New England (MetLife), where he managed multiple bond portfolios, including taxable and tax exempt mutual funds and separate accounts. Jim holds an M.B.A. from Columbia University, New York, as well as an M.S. in Applied Math and B.S. in Applied Math and Economics from the State University of New York at Stony Brook. He is a Chartered Financial Analyst and a member of the Boston Society of Security Analysts.

Recent Articles

November 8, 2024
How do my income taxes affect my Medicare premiums? Although most Medicare enrollees are paying a Medicare Part B premium of $174.70 in 2024, many people pay much more. Prior to 2007, everyone received the same 75% subsidy from the government and paid the same premium. Then IRMAA (Income Related Monthly Adjustment Amount) was implemented, which established a bracket system for both Part B and Part D (prescriptions). The higher your income, the lower the subsidy and the higher your Medicare premium. Because Medicare uses your tax return from two years prior to determine your premium for the coming year, your 2024 premium was based on your 2022 tax return. The specific income figure used is Modified Adjusted Gross Income, which adds tax-exempt income to the AGI figure you see on your tax return. Sometimes, the higher premium comes as a shock, after a year of unusually high income, perhaps due to a capital gain from the sale of a home. But if that is the case, the higher premium will only be applied for one year, and once income declines, so will the premium. It’s important to know that if there has been a life-changing event that reduced your household income, such as retirement or the loss of a spouse, you can apply to have the premium lowered. Are there ways to limit the higher premiums? There may be. First, avoid (if possible) making large withdrawals from your tax-deferred retirement plans, including Traditional IRAs and 401(k)s, in a single year, or taking a very large capital gain on a stock sale in a nonretirement account in any one tax year. Instead, try to spread the IRA withdrawals or capital gains over two or more years, or take a capital loss if you have any in your nonretirement account. You also may be able to make a tax-deductible IRA contribution to lower your AGI below the IRMAA threshold, as long as you had earned income during the year and qualify for a deduction. Are my charitable contributions deductible? Ever since the 2017 tax law increased the standard deduction (while eliminating the personal exemption), most people do not see a reduction their taxes as a result of making charitable contributions. However, there are some exceptions. Taxpayers whose total itemized deductions (medical expenses above a certain threshold, mortgage interest, state and local taxes up to $10,000, charitable contributions) exceed their standard deduction can lower their taxes with charitable contributions. There is also something called a Qualified Charitable Deduction (QCD), available to IRA owners over age 70½. Under current tax law, you can instruct your IRA custodian to send your contribution directly from your IRA to the qualified charity or send you the check made out to the charity, which you can forward, rather than making the charitable contribution yourself. This has the same effect as a tax deduction because it lowers the amount of your taxable IRA distributions. It may also lower your AGI enough to reduce your Medicare premium or your capital gains rate. Withdrawals to make a QCD can count toward your Required Minimum Distribution for the year. Additional points on charitable deductions: (1) Most of the provisions in the 2017 tax law expire in 2025, so in 2026 we could see reinstated personal exemptions and a return to lower standard deductions, which would make charitable contributions more likely to lower your tax liability. (2) Some states, including Massachusetts (cash contributions only) and New York, allow a charitable deduction against income for state income taxes. How much of my Social Security income is taxed? There is a rather complicated formula that determines the taxable portion of your Social Security benefits. The formula adds half of your Social Security income to your AGI plus your tax-exempt income to get provisional income. If that figure falls under $25,000 (single filer) or $32,000 (joint filer), none of the benefits are taxable, which is the case for about 60% of recipients, who have little or no income other than Social Security. The other 40% pay tax on between 1% and 85% of their Social Security income, but no more than 85%, regardless of how much additional income they have. As time goes on, more and more people pay tax on more and more of their SS income, because the formula does not get adjusted for inflation every year, unlike with most other tax figures and unlike with SS benefits themselves. Note: State taxation of Social Security varies, with some states, including Massachusetts, not taxing it at all. What is the Net Investment Income Tax? Most taxpayers do not pay this tax, which came into being in 2013 to help cover the cost of the Medicare program. The approximately 5% of taxpayers who are subject to the tax have AGI of over $250,000 (joint) or $200,000 (single). The 3.8% tax is applied to either (1) the amount by which AGI exceeds these thresholds, or (2) the amount of net taxable investment income, whichever is lower. The same strategies discussed above regarding Medicare premiums could also be employed to minimize this tax. When I get a cost-of-living raise at work, will that push me into a higher income tax bracket? While a large raise at work could push you into a higher income tax bracket, if your raise is roughly equivalent to the inflation rate, it should not affect your marginal tax bracket. Every year, most tax figures, including tax bracket boundaries and the standard deduction, are adjusted to reflect increases in inflation, as measured by the “chained CPI”, an alternative to the traditional consumer price index, which attempts to account for the effects of product substitution on changes in the cost of living. Some figures, such as maximums for IRAs and 401(k) contributions, are adjusted only in years when applying the CPI rounds the figure up to the next increment, usually $500. What will happen to federal income tax rates and estate taxes in 2026? If Congress does nothing, most of the provisions of the 2017 tax legislation will expire and revert to the higher tax rate structure that was previously in place. However, leaders of both major political parties are not in favor of raising tax rates for taxpayers with less than $400,000 in income. The parties disagree on taxes for taxpayers with incomes above $400,000. There are also differences between the two parties on future of the estate tax exclusion, which will rise to $13,990,000 per person in 2025 but will fall to about half that in 2026 without action by Congress. Annual gifting is one way to lower one’s taxable estate. The annual gift tax exclusion in 2024 is $18,000 per person per donee for 2024 and is adjusted for inflation in $1,000 increments. As always, if you have any questions about taxes, please reach us any time at (833) 888-0534 x2 or info@westbranchcapital.com The views and information contained in this article and on this website are those of West Branch Capital LLC and are provided for general information. The information herein should not serve as the sole determining factor for making legal, tax, or investment decisions. All information is obtained from sources believed to be reliable, but West Branch Capital LLC does not guarantee its reliability. West Branch Capital LLC is not an attorney, accountant or actuary and does not provide legal, tax, accounting or actuarial advice.
November 7, 2024
One of the most important questions to ask about any investment account is: “what percentage of the account is allocated to equities (stocks)?” This is an important question, in general, because equity exposure will increase the volatility of the account. In a strong bull market (like we are experiencing currently), equity allocation is a major driver of positive returns relative to fixed income (bonds) or cash. During a stock market correction (decline), equity allocation will negatively impact performance relative to bonds or cash, therefore, in both instances contributing to large variability of the account value. It is important to note that these points are generalizations, not rules. There are exceptions. For example, a highly speculative fixed income investment like a junk bond can be more volatile than a high quality defensive stock. Generalizations are best applied to broad market indices (e.g. the S&P 500 and the U.S. Aggregate Bond Index) or baskets of well-chosen high-quality stocks and investment grade bonds. Because of the increased volatility of equities, they have an especially significant impact on any account during bull and bear markets. While past returns are no guarantee of future returns, equities have also delivered higher returns than fixed income over the long term historically. In the WBC client portal, you can view the performance of your holdings by asset class (Equity, Fixed Income, others) by clicking “Reports” along the top bar, then selecting “Account Performance” under “Performance” and scrolling down. Comparing Equity and Bond Returns Two of the most widely used performance measures for US equities and US investment grade bonds are the SPDR S&P 500 ETF Trust (Ticker: SPY, which tracks the S&P 500) and the iShares Core US Aggregate Bond ETF (Ticker: AGG, which tracks the Bloomberg US Aggregate Bond Index). Based on these two measures, as shown in the table below, equities have outperformed fixed income significantly. On a total return basis, equities have outperformed over the last 1, 3, 5, 10 and 20-year periods. Holding the S&P 500 for the last 20 years would have earned a 677% total return. This return is 598% higher than the total return from the bond index. 
How to Protect Against Inflation
By Ian Mahmud August 28, 2024
With inflation easing and the US economy showing some signs of weakness, the market is now turning its attention to a potential rate cut.

Share Article

Share by: