Quick Links
Contact Us
Send a Message
Newsletter
We will get back to you as soon as possible.
Please try again later.
Bond Market Update
The year 2022 saw interest rates increase across all maturities as inflation soared to levels not seen in several decades. What had been considered transient inflation due to supply chain constraints/bottlenecks turned out to be intransient. To rein in inflation, the Federal Reserve embarked on a series of interest rate increases beginning early in the year. The Fed Funds rate which had been close to 0% in early 2022 has risen through a series of rate hikes of .75% and a recent increase of .5% to a level of 4.25-4.5%. While goods and services inflation have eased somewhat, with November’s annual CPI at 7.1% down from over 8% in prior months, other factors continue to weigh on the inflation outlook. Specifically, wage inflation remains a concern; in November, average hourly earnings were up 5.1% and the unemployment rate held steady at a low 3.7%. In December, wage growth slowed but the unemployment rate declined further to 3.5%. With demand for workers exceeding supply, wage inflation remains a source of concern. Shelter (housing and rent) costs have come down but remain persistently high. The Fed wants to get inflation down to 2% and has indicated the Fed Funds rate may go as high as 5% to reach its goal. It is willing to risk an economic recession to accomplish this. Any signs of stronger growth or exuberant equity markets could hinder the Fed’s efforts to cool inflation. Therefore, prices need to slow more significantly, or higher rates may be in store.
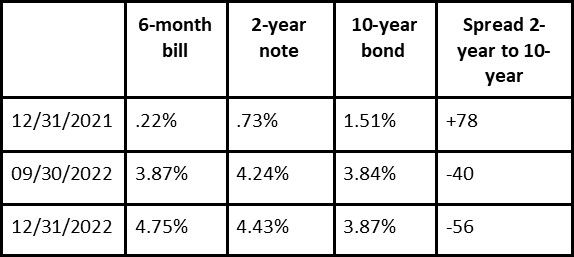
The yield curve or yields from short to longer term bonds is typically positive as investors demand more yield to commit to a longer timeframe. However, that difference has become extremely inverted, meaning short term rates today are much higher than longer term rates. At year-end, the two-year US treasury yield was 4.43% while the 10-year yield was 3.87%, putting the two-year 56 basis points higher than the 10-year. As the chart below shows, this difference was +78 basis points in the other direction at the beginning of 2022. The six-month bill to the 10-year inversion at 88 basis points at year-end is even more dramatic:

When inversions this extreme occur, it typically signals investors’ desire to lock in longer term rates in expectation that the Fed will ultimately lower rates. Whether this occurs will ultimately depend on the path of inflation. Historically inversions of this magnitude have resulted in slowing economic growth which should lead to slowing price increases.
While the yield curve points to a coming recession, and an end to Fed tightening will eventually occur, the goal of 2% inflation appears far away. Therefore, it is more likely the Fed will deliver higher rates rather than the rate cuts the market is expecting.
What fixed income strategies should be pursued?
The major risk going forward for bonds is inflation staying persistently high forcing the Fed to raise rates more than the markets currently expect. Other central banks around the world are also in the process of raising their interest rates. After a period that saw negative interest rates in many countries, currently only Japan is left with negative interest rates. The path of least resistance in the short- to intermediate term is for higher rates. A further increase in yields will negatively impact companies through higher borrowing costs. Higher mortgage rates would further crimp housing, and consumer spending could decline as credit card and auto loan rates increase. The result could be increased delinquencies and defaults on debt and ultimately a recession.
Fortunately, at the present time inflation expectations remain low. This can be observed by looking at the 10-year breakeven inflation rate. This is a metric we have referred to in the past. As a refresher, it is the difference between the nominal 10-year treasury yield and the yield on a 10-year treasury inflation protected security (known as TIPS). Currently the breakeven rate stands at a low 2.3% which is close to the Fed’s inflation target. This number means that investors expect inflation to average 2.3% per year over the next 10 years. To put it another way, an investor who buys the TIPS note today would need inflation to average 2.3% per year for the next 10 years to break even— any higher level of inflation and they are ahead. In general, this gauge has been a good predictor of future inflation. While inflation today is still high, prices for items such as gas, used cars and rental costs are coming down. The 2% desired level of inflation appears far away but some comfort can be taken in the breakeven number which indicates it could ultimately be achieved.
Fed chairman Jerome Powell has made it very clear he is willing to sacrifice an economic slowdown to prevent inflation from becoming embedded in the economy. Knowing this, investors should prepare for higher short-term rates. However, when there is any sign that inflation in coming close to the 2% level, bond maturities should be extended and credit risk increased to take advantage of potentially declining long-term yields and narrowing credit spreads.
Fixed Income Strategies
6–12-month time horizon…
- With treasury bills in the 4% plus range, build a ladder maturity portfolio in treasury bills from three months to one year.
- With a looming recession, concentrate corporate bond holdings in high quality companies rated “A” or higher. This can be accomplished through individual bonds or through a diversified high-quality fund such as IGSB (iShares 1-5 year investment grade corporate bond fund).
- Avoid high yield bonds. While high yield bond spreads over treasury securities appear attractive, a slowing economy will hurt lower quality companies causing spreads to widen.
- Keep overall bond maturities short in the two– to five-year range
When reported inflation approaches 3%, there can be some confidence the end of Fed tightening may be in sight. At that point…
- Extend bond maturities out to 10 years through building a bond ladder of 2- 10 years using individual bonds.
- Focus purchases on individual Investment grade corporate bonds with credit ratings in the BBB or higher range.
- Alternatively use IGIB (iShares 5-10- year investment grade corporate bond fund) along with IGSB to build a diversified portfolio. LQD (iShares investment grade corporate bond fund) which a longer maturity can be used for those willing to take more maturity risk.
- Build a modest position in high yield bonds rated BB or higher. An improving economy will benefit lower quality credits. This can be accomplished using HYG (iShares high yield corporate bond fund).
These suggestions may be appropriate for some clients, but there are other funds to choose from which may be just as good. Never has it been more critical than today to monitor the inflation picture to determine what actions the Fed may take next.
As always, contact us anytime with your bond market or other questions by email or by calling (833) 888-0534 x2.
The views and information contained in this article and on this website are those of West Branch Capital LLC and are provided for general information. The information herein should not serve as the sole determining factor for making legal, tax, or investment decisions. All information is obtained from sources believed to be reliable, but West Branch Capital LLC does not guarantee its reliability. West Branch Capital LLC is not an attorney, accountant or actuary and does not provide legal, tax, accounting or actuarial advice.
About The Author
James K. Ho
Jim has over thirty years of investment management experience. He is a Managing Director and Principal of the firm. Prior to West Branch Capital, Jim was a fixed income Portfolio Manager at John Hancock Advisors. Previously, he managed the John Hancock Tax Exempt Income Trust. Prior to joining John Hancock Advisors, Jim was a Senior Investment Officer at The New England (MetLife), where he managed multiple bond portfolios, including taxable and tax exempt mutual funds and separate accounts. Jim holds an M.B.A. from Columbia University, New York, as well as an M.S. in Applied Math and B.S. in Applied Math and Economics from the State University of New York at Stony Brook. He is a Chartered Financial Analyst and a member of the Boston Society of Security Analysts.
Important Links
Subscribe to our newsletter
Newsletter
Thanks for subscribing to our newsletter.
Please try again later.
Our Locations
Contact Us
Send A Message
Footer Form
We will get back to you as soon as possible.
Please try again later.
West Branch Capital was recognized by investor.com as a 2019 Trusted Firm. View our profile. To learn more about the trust algorithm, visit investor.com/trust-algorithm.
The Financial Times 300 Top Registered Investment Advisers is an independent listing produced annually by the Financial Times (June, 2017). The FT 300 is based on data gathered from RIA firms, regulatory disclosures, and the FT’s research. The listing reflected each practice’s performance in six primary areas: assets under management, asset growth, compliance record, years in existence, credentials and online accessibility. This award does not evaluate the quality of services provided to clients and is not indicative of the practice’s future performance. Neither the RIA firms nor their employees pay a fee to The Financial Times in exchange for inclusion in the FT 300.
All Rights Reserved | West Branch Capital


