Quick Links
Contact Us
Send a Message
Newsletter
We will get back to you as soon as possible.
Please try again later.
Bond Market Update
Early in the year bond yields declined along with an improved stock market on hopes the Federal Reserve would slow its pace of rate increases. After raising rates at the fastest pace since the 1980s, inflation and economic growth appeared to have slowed. Investors interpreted the Fed’s .25% rate increase in February, down from as high as .75% previously, as a sign there could be a pivot to rate cuts later this year. However, subsequent economic data showed inflation numbers remaining elevated and a resilient economy. Labor markets are extremely tight with the recently reported unemployment rate at a historically low 3.5%. Investment markets reacted negatively. With inflation running in the high single digits interest rates began to retrace their steps and moved higher.
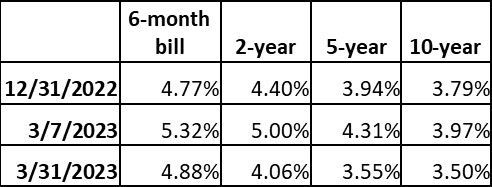
Here is a recap of yields in the first quarter:

In early March two large banks, Silicon Valley Bank and Signature Bank, were both shut down by the FDIC. These two banks became insolvent not from investing in risky products but from investing in us treasury and government guaranteed mortgage-backed securities that were mismatched in maturity to their large uninsured deposit base. Silicon Valley Bank catered to the tech industry which, with recent troubles, companies’ saw their cash holdings decline. Signature Bank catered to Crypto firms which also had cash flow issues. The Fed’s campaign to slow the economy and bring inflation down led to large unrealized losses in these securities as rates climbed. When customers demanded their money back, forced sales were made at significant losses resulting in the inability to meet withdrawal demands. The FDIC stepped in to protect all depositors but did not to save the banks. The Fed, recognizing the risk its interest rate increases created, raised rates by a modest .25% in March. While bank stocks have come under pressure, we feel the government’s actions should prevent a systemic problem developing. Most banks do not have a concentrated deposit base that these banks had.
This event led to a flight to safety in the bond market. Yields on treasury securities declined as investors perceived these events would lead to a moderation of Fed policy with potentially a cut in short term rates later this year. The 2-year treasury yield reached a peak of 5% during the quarter and the 2 years to 10-year spread reached a negative 130 basis points at its widest. After the banking crisis yields declined rapidly as investors sought safety. The 2 to 10 years spread stood at a negative 56 basis points at quarter end, and as the chart above shows yields have come down. In contrast corporate bond spreads widened in most cases and only the highest quality companies were able to take advantage of these lower rates during this period.
The rapid increase in interest rates has thus far had only a modest effect on bringing inflation down. The Fed’s primary goal is to get inflation close to 2%. While recent economic numbers have shown some signs of cooling in producer prices and retail sales it is uncertain whether this trend will be sustained; recently reported price increases have been in the 4-5% range. The Fed is caught between maintaining financial market stability and controlling inflation. The recent turmoil in the banking sector could cause smaller local banks to lose deposits and pull back on lending. The result could be a credit crunch leading to slower household and business borrowing, spending, and investing. This increases the risk of recession.
The US Treasury yield curve is sending a warning about the economy. The 2-year/10-year yield curve – which had been flattening for the past two years and inverted in mid-2022 – has steepened since the recent banking tumult. The spread between the 10-year and 2-year has narrowed to -47 basis points from -130 basis points on March 10th. An inverted yield curve – whereby shorter-dated bonds yield more than longer-dated ones – is considered a reliable recession indicator, reflecting the expectation that monetary policy tightening will hurt the economy. The recent steepening is a signal that investors expect a pivot to rate cuts as a recession takes hold.
The question facing investors is whether they should heed the signal from the recent steepening yield curve or ignore it as a false signal.
The answer depends on whether the Fed will follow through with rate cuts. We feel while the Fed is near the end of the tightening cycle, but it is unlikely to deliver the rate cuts that are currently priced in for 2023. The banking issue appears to be contained, and with the inflation still elevated the Feds job is not done. If this scenario unfolds it will lead to a bear flattening of the yield curve whereby rates rise with short term rates rising more than long term rates.
Could the banking crisis develop into a systemic problem?
The recent bank failures raise the question of what about other banks. Do they have similar issues? The answer is many banks have risks that are not apparent to most investors, but the Feds recent actions should prevent further problems. While most banks do not have the concentrated uninsured deposit base that Silicon Valley Bank and Signature bank had, the securities portfolio of many institutions have similar risk profiles.
The securities holdings of banks are classified by each individual bank into three categories:
- Trading
- Available for sale
- Held to maturity
Securities classified as trading are marked at their market prices and any increase or decrease in value is reflected in the bank’s earnings. Available for sale securities are carried at market prices but any change in value is only recorded as a reduction in equity and is not reflected in earnings. Held to maturity securities are not marked at their fair value but maintained at their original purchase price regardless of price changes.
As interest went up in the last year only the decline in the value of securities classified as “trading “were reflected in bank earnings. When Silicon Valley bank and Signature bank were forced to sell their “available for sale” and “held to maturity” securities large losses, which had not been recognized previously were realized.
Other banks have similar unrealized losses in their securities portfolio. However, the Federal Reserve has created a facility called “Bank Term Funding Program”. This lending program allows banks to receive advances from the Fed for up to a year by pledging their debt securities holdings as collateral. Effectively this will prevent banks from having to sell their holdings at a loss if they were to face large deposit redemptions. With this facility in place, it is most likely the banking crisis will be contained and not become systemic.
If you have questions about the bond market or any other topics, please reach us at (833) 888-0534 x2 or info@westbranchcapital.com.
The views and information contained in this article and on this website are those of West Branch Capital LLC and are provided for general information. The information herein should not serve as the sole determining factor for making legal, tax, or investment decisions. All information is obtained from sources believed to be reliable, but West Branch Capital LLC does not guarantee its reliability. West Branch Capital LLC is not an attorney, accountant or actuary and does not provide legal, tax, accounting or actuarial advice.
About The Author
James K. Ho
Jim has over thirty years of investment management experience. He is a Managing Director and Principal of the firm. Prior to West Branch Capital, Jim was a fixed income Portfolio Manager at John Hancock Advisors. Previously, he managed the John Hancock Tax Exempt Income Trust. Prior to joining John Hancock Advisors, Jim was a Senior Investment Officer at The New England (MetLife), where he managed multiple bond portfolios, including taxable and tax exempt mutual funds and separate accounts. Jim holds an M.B.A. from Columbia University, New York, as well as an M.S. in Applied Math and B.S. in Applied Math and Economics from the State University of New York at Stony Brook. He is a Chartered Financial Analyst and a member of the Boston Society of Security Analysts.
Important Links
Subscribe to our newsletter
Newsletter
Thanks for subscribing to our newsletter.
Please try again later.
Our Locations
Contact Us
Send A Message
Footer Form
We will get back to you as soon as possible.
Please try again later.
West Branch Capital was recognized by investor.com as a 2019 Trusted Firm. View our profile. To learn more about the trust algorithm, visit investor.com/trust-algorithm.
The Financial Times 300 Top Registered Investment Advisers is an independent listing produced annually by the Financial Times (June, 2017). The FT 300 is based on data gathered from RIA firms, regulatory disclosures, and the FT’s research. The listing reflected each practice’s performance in six primary areas: assets under management, asset growth, compliance record, years in existence, credentials and online accessibility. This award does not evaluate the quality of services provided to clients and is not indicative of the practice’s future performance. Neither the RIA firms nor their employees pay a fee to The Financial Times in exchange for inclusion in the FT 300.
All Rights Reserved | West Branch Capital


