Contact Us


Send a Message

Get the latest news delivered to your inbox.

Newsletter

West Branch Capital Logo

Independent fee-only, minority owned SEC Registered Investment Adviser

Why the Inflation Rate Doesn’t Tell the Whole Story

July 26, 2021
Why the Inflation Rate Doesn’t Tell the Whole Story

Markets, economists and policymakers have been fretting about inflation for months, worried that the trillions of dollars being spent in recent and future government stimulus programs could overheat the economy and send prices soaring.


On May 12, 2021, the worrywarts seemed to have their fears confirmed when the April consumer price index shot up a seasonally adjusted 0.8%, the biggest jump since 2008. The year-over-year inflation rate of 4.2% is double what the Federal Reserve has set as its target.


Should consumers be concerned? As a finance expert, I believe the answer to this question lies in a closer look at what actually goes into the main way the US measures inflation.


What is inflation? Inflation is defined as the change in the price of everything from a rib-eye steak and a bar of Ivory soap to an eye exam or tank of gas.


In the US, the most commonly used measure of inflation is based on the consumer price index. Simply put, the index is the average price of a basket of goods and services that households typically purchase. It’s often used to determine pay raises or to adjust benefits for retirees. The year-over-year change is what we call the inflation rate.


Since this is an average across a range of categories, the main number masks lots of key details and big month-to-month swings in various goods and services. For example, airline fares jumped a seasonally adjusted 10% in April – partly recovering from their pandemic plunge – while shelfstable fish and seafood declined 3.5%.


Food and energy prices in particular can be very volatile, and, for that reason, policymakers often focus on what is known as “core inflation,” which excludes those numbers.


A moderate amount of inflation is generally considered to be a sign of a healthy economy, because as the economy grows, demand for stuff increases. This increase in demand pushes prices a little higher as suppliers try to create more of the things that consumers and businesses want to buy. Workers benefit because this economic growth drives an increase in demand for labor, and as a result, wages usually increase – as the latest jobs report suggests is beginning to happen.


Workers with higher wages then can go out and buy more stuff, part of a “virtuous” cycle that keeps the economy humming. Inflation isn’t really causing all this to happen – it is merely the symptom of a healthy, growing economy.


But when inflation is too high – or too low – a “vicious” cycle can take its place. If left unchecked, inflation could spike, which would likely cause the economy to slow down quickly and unemployment to increase. The combination of rising inflation and unemployment is called “stagflation,” and is feared by economists, central bankers and pretty much everyone else.
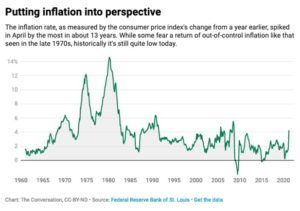

inflation graph

It’s what can cause an economic boom to suddenly turn to bust, as Americans saw in the late 1970s. The Fed managed to reduce inflation to normal levels only after driving up short-term interest rates to a record 20% in 1979.


What’s behind the increase in the inflation rate? So, how can we determine if this is happening now? Let’s take a closer look at what makes up the consumer price index.


Much of the increase in April was driven by used car and truck prices, which jumped 10% during the month, by far the biggest increase of any category that makes up at least 1% of the index. As has been reported, that was largely due to a surge in buying by rental car companies, which sold off much of their inventories early in the pandemic, as well as the global chip shortage that has reduced production of new vehicles. Other price increases, such as for lumber and some electronics, are also tied to short-term supply chain problems.


Increased demand from consumers who have received stimulus checks is another possible cause of price increases, but it’s harder to quantify the effect.


Most categories were much lower. Food prices grew 0.4%, driven by demand for takeout, and energy was down 0.1% – though that was before May’s East Coast pipeline problems.


Because the consumer price index is made up of a range of goods and services, it’s often the case that changes in the index – and therefore inflation – are being driven by just one or two parts of the economy, as opposed to an across-the-board price change. In the case of April prices, transportation-related items like used vehicles and airfares and energy services like electricity were the biggest drivers. And these appear to be transitory increases.


Nothing to fret about – for now This is why most economists don’t think the U.S. is heading into a new period of high inflation. Instead, there is evidence of pent-up demand, particularly for services that were unavailable during the height of the pandemic in the U.S., which may result in some short-term jumps in prices.


There are signs that inflation will be a bit high for another month or two, but it should return to more normal levels of around 2% per year by the end of 2021. The Fed is banking on this as well.

So, back to our initial question: Is there any reason for alarm?


I don’t think so, nor do most economists or the Fed. Others, especially investors, disagree. We won’t know who is ultimately right for some time.


Meanwhile, consumers can expect to pay a bit more this summer if they’re finally planning to take a vacation after a year stuck at home, buy a used car to travel the country or build a new home. But even at higher prices, these are all signs of the return of a well-functioning economy – and normal life.


If you have questions about inflation or other concerns, reach West Branch Capital any time at (833) 888-0534.


Article shared with permission from Financial Media Exchange and Author Richard S. Warr.


About The Author

Ayaz Mahmud

Ayaz brings almost thirty years of investment management experience to West Branch Capital. He serves as the firm’s Chief Executive Officer. Ayaz founded West Branch Capital in 2004 after spending over twenty years as a top wealth advisor at premier global investment banks: Kidder Peabody, Smith Barney and Lehman Brothers. At Lehman Brothers, he helped build the Wealth Management Group in Boston and co-managed the Equity and Fixed Income Middle Market Institutional Trading Desks. Ayaz has managed client portfolios throughout his career. Ayaz holds an M.A/M.B.A and a B.A/B.S from Syracuse University.

Recent Articles

November 8, 2024
How do my income taxes affect my Medicare premiums? Although most Medicare enrollees are paying a Medicare Part B premium of $174.70 in 2024, many people pay much more. Prior to 2007, everyone received the same 75% subsidy from the government and paid the same premium. Then IRMAA (Income Related Monthly Adjustment Amount) was implemented, which established a bracket system for both Part B and Part D (prescriptions). The higher your income, the lower the subsidy and the higher your Medicare premium. Because Medicare uses your tax return from two years prior to determine your premium for the coming year, your 2024 premium was based on your 2022 tax return. The specific income figure used is Modified Adjusted Gross Income, which adds tax-exempt income to the AGI figure you see on your tax return. Sometimes, the higher premium comes as a shock, after a year of unusually high income, perhaps due to a capital gain from the sale of a home. But if that is the case, the higher premium will only be applied for one year, and once income declines, so will the premium. It’s important to know that if there has been a life-changing event that reduced your household income, such as retirement or the loss of a spouse, you can apply to have the premium lowered. Are there ways to limit the higher premiums? There may be. First, avoid (if possible) making large withdrawals from your tax-deferred retirement plans, including Traditional IRAs and 401(k)s, in a single year, or taking a very large capital gain on a stock sale in a nonretirement account in any one tax year. Instead, try to spread the IRA withdrawals or capital gains over two or more years, or take a capital loss if you have any in your nonretirement account. You also may be able to make a tax-deductible IRA contribution to lower your AGI below the IRMAA threshold, as long as you had earned income during the year and qualify for a deduction. Are my charitable contributions deductible? Ever since the 2017 tax law increased the standard deduction (while eliminating the personal exemption), most people do not see a reduction their taxes as a result of making charitable contributions. However, there are some exceptions. Taxpayers whose total itemized deductions (medical expenses above a certain threshold, mortgage interest, state and local taxes up to $10,000, charitable contributions) exceed their standard deduction can lower their taxes with charitable contributions. There is also something called a Qualified Charitable Deduction (QCD), available to IRA owners over age 70½. Under current tax law, you can instruct your IRA custodian to send your contribution directly from your IRA to the qualified charity or send you the check made out to the charity, which you can forward, rather than making the charitable contribution yourself. This has the same effect as a tax deduction because it lowers the amount of your taxable IRA distributions. It may also lower your AGI enough to reduce your Medicare premium or your capital gains rate. Withdrawals to make a QCD can count toward your Required Minimum Distribution for the year. Additional points on charitable deductions: (1) Most of the provisions in the 2017 tax law expire in 2025, so in 2026 we could see reinstated personal exemptions and a return to lower standard deductions, which would make charitable contributions more likely to lower your tax liability. (2) Some states, including Massachusetts (cash contributions only) and New York, allow a charitable deduction against income for state income taxes. How much of my Social Security income is taxed? There is a rather complicated formula that determines the taxable portion of your Social Security benefits. The formula adds half of your Social Security income to your AGI plus your tax-exempt income to get provisional income. If that figure falls under $25,000 (single filer) or $32,000 (joint filer), none of the benefits are taxable, which is the case for about 60% of recipients, who have little or no income other than Social Security. The other 40% pay tax on between 1% and 85% of their Social Security income, but no more than 85%, regardless of how much additional income they have. As time goes on, more and more people pay tax on more and more of their SS income, because the formula does not get adjusted for inflation every year, unlike with most other tax figures and unlike with SS benefits themselves. Note: State taxation of Social Security varies, with some states, including Massachusetts, not taxing it at all. What is the Net Investment Income Tax? Most taxpayers do not pay this tax, which came into being in 2013 to help cover the cost of the Medicare program. The approximately 5% of taxpayers who are subject to the tax have AGI of over $250,000 (joint) or $200,000 (single). The 3.8% tax is applied to either (1) the amount by which AGI exceeds these thresholds, or (2) the amount of net taxable investment income, whichever is lower. The same strategies discussed above regarding Medicare premiums could also be employed to minimize this tax. When I get a cost-of-living raise at work, will that push me into a higher income tax bracket? While a large raise at work could push you into a higher income tax bracket, if your raise is roughly equivalent to the inflation rate, it should not affect your marginal tax bracket. Every year, most tax figures, including tax bracket boundaries and the standard deduction, are adjusted to reflect increases in inflation, as measured by the “chained CPI”, an alternative to the traditional consumer price index, which attempts to account for the effects of product substitution on changes in the cost of living. Some figures, such as maximums for IRAs and 401(k) contributions, are adjusted only in years when applying the CPI rounds the figure up to the next increment, usually $500. What will happen to federal income tax rates and estate taxes in 2026? If Congress does nothing, most of the provisions of the 2017 tax legislation will expire and revert to the higher tax rate structure that was previously in place. However, leaders of both major political parties are not in favor of raising tax rates for taxpayers with less than $400,000 in income. The parties disagree on taxes for taxpayers with incomes above $400,000. There are also differences between the two parties on future of the estate tax exclusion, which will rise to $13,990,000 per person in 2025 but will fall to about half that in 2026 without action by Congress. Annual gifting is one way to lower one’s taxable estate. The annual gift tax exclusion in 2024 is $18,000 per person per donee for 2024 and is adjusted for inflation in $1,000 increments. As always, if you have any questions about taxes, please reach us any time at (833) 888-0534 x2 or info@westbranchcapital.com The views and information contained in this article and on this website are those of West Branch Capital LLC and are provided for general information. The information herein should not serve as the sole determining factor for making legal, tax, or investment decisions. All information is obtained from sources believed to be reliable, but West Branch Capital LLC does not guarantee its reliability. West Branch Capital LLC is not an attorney, accountant or actuary and does not provide legal, tax, accounting or actuarial advice.
November 7, 2024
One of the most important questions to ask about any investment account is: “what percentage of the account is allocated to equities (stocks)?” This is an important question, in general, because equity exposure will increase the volatility of the account. In a strong bull market (like we are experiencing currently), equity allocation is a major driver of positive returns relative to fixed income (bonds) or cash. During a stock market correction (decline), equity allocation will negatively impact performance relative to bonds or cash, therefore, in both instances contributing to large variability of the account value. It is important to note that these points are generalizations, not rules. There are exceptions. For example, a highly speculative fixed income investment like a junk bond can be more volatile than a high quality defensive stock. Generalizations are best applied to broad market indices (e.g. the S&P 500 and the U.S. Aggregate Bond Index) or baskets of well-chosen high-quality stocks and investment grade bonds. Because of the increased volatility of equities, they have an especially significant impact on any account during bull and bear markets. While past returns are no guarantee of future returns, equities have also delivered higher returns than fixed income over the long term historically. In the WBC client portal, you can view the performance of your holdings by asset class (Equity, Fixed Income, others) by clicking “Reports” along the top bar, then selecting “Account Performance” under “Performance” and scrolling down. Comparing Equity and Bond Returns Two of the most widely used performance measures for US equities and US investment grade bonds are the SPDR S&P 500 ETF Trust (Ticker: SPY, which tracks the S&P 500) and the iShares Core US Aggregate Bond ETF (Ticker: AGG, which tracks the Bloomberg US Aggregate Bond Index). Based on these two measures, as shown in the table below, equities have outperformed fixed income significantly. On a total return basis, equities have outperformed over the last 1, 3, 5, 10 and 20-year periods. Holding the S&P 500 for the last 20 years would have earned a 677% total return. This return is 598% higher than the total return from the bond index. 
How to Protect Against Inflation
By Ian Mahmud August 28, 2024
With inflation easing and the US economy showing some signs of weakness, the market is now turning its attention to a potential rate cut.

Share Article

Share by: